For those investors who cant to keep on eye on CSE trends, one of the best places do this is at a nice investor resource site called Stockhouse.
One of the coolest features of this site is the Markets Tab where you can see the subheading CSE. This is the dedicated area to CSE markets where you can see the Market Movers table and top volume and gainer charts.
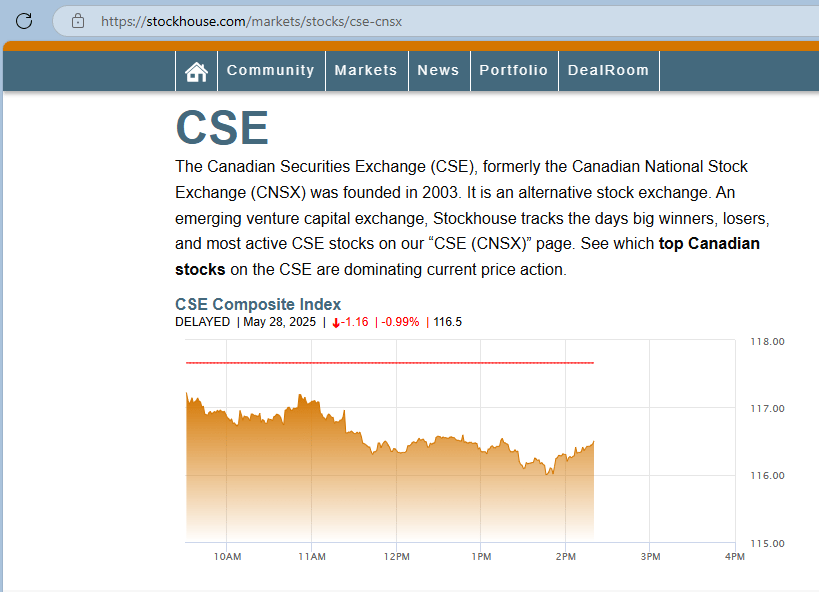
You will see the CSE chart, then if you scroll down on the page you will see the Market Movers charts with the most active stocks, and the most highly traded gainer-wise. These are daily reports that day-traders rely on for making important decisions. It indicates cause for investigation, and can yield traders a profit or loss depending on if they hold the stock or not. For those that are speculating and doing research, this market tab provides opportunities for new trends and diamonds in the rough. For savvy investors, this is your starting place for morning trend readouts if you are trading that day and looking to move in or out of new prospects.
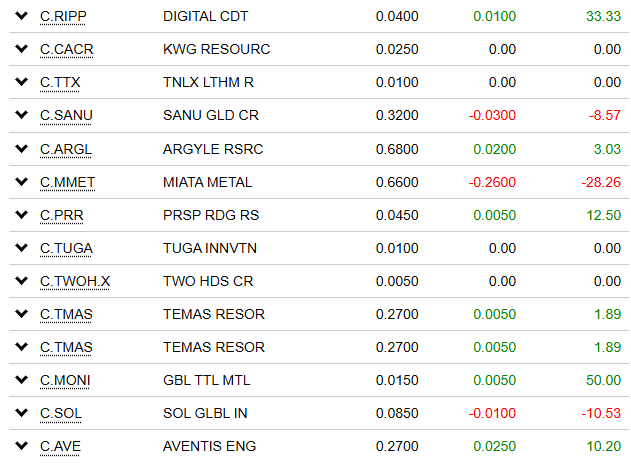
Some of the things to look for on the Most Actives list are the price, price change, and percent change fields.
Green is gain, and red is loss, and you can quickly tell what type of companies are trending based on their name and ticker symbol fields.
For savvy investors, some of these names will also indicate industry, such as C.RIPP and C.SOL being respective of crypto industries. C.AVE, Aventis ENG can be interpreted as Aventis Energy, and you can read into the symbols and pricing to identify trends.

Leave a comment